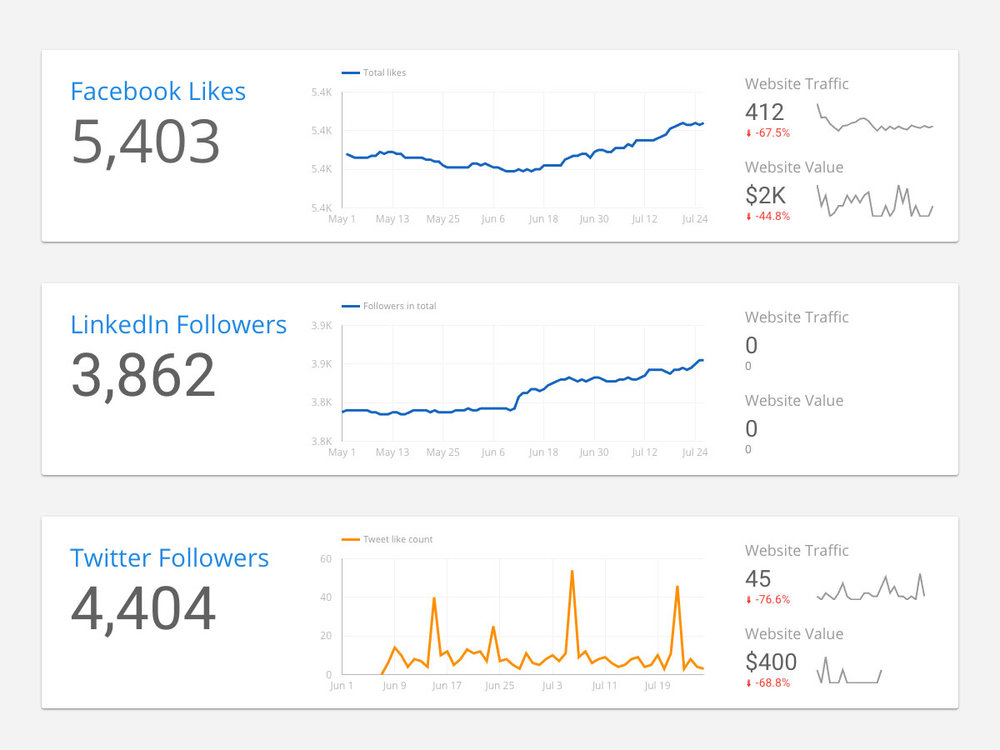
Social media has become a vital aspect of digital marketing and businesses. It provides businesses with a platform to reach out to their target audience and engage with them. However, tracking the performance of your social media campaigns can be a daunting task, especially when you are managing multiple channels. This is where data analytics and reporting come into play. By analyzing the performance of your social media campaigns, you can optimize your strategy and improve your results.
Google Data Studio is a powerful tool that can help you simplify social media analytics and reporting. It allows you to connect various data sources, including social media platforms, and create dynamic, visually appealing reports. In this blog post, we will explore how you can use Google Data Studio for social media analytics and reporting.

The first step is to connect your social media platforms to Google Data Studio. Currently, Data Studio supports the following social media platforms: Facebook, Twitter, LinkedIn, and YouTube. To connect your social media accounts, you need to create data sources. Here’s how to do it:
Once you have created data sources for all your social media platforms, you can start building your report.
Google Data Studio provides you with a variety of visualization options, including tables, charts, and graphs, to create visually appealing reports.
● Start with a clear objective:
Before you start building your report, define your objective. Do you want to track the performance of your social media campaigns or compare the performance of different channels? Defining your objective will help you choose the right metrics and dimensions for your report.
● Choose the right metrics and dimensions:
Google Data Studio provides you with a wide range of metrics and dimensions for social media analytics. Some of the common metrics include reach engagement, clicks, and conversions. Depending on your objective, you can choose the metrics and dimensions that are relevant to your report.
● Use filters to segment your data:
Filters allow you to segment your data and focus on specific segments of your audience. For example, you can create filters to track the performance of your social media campaigns by location, age, or gender.
● Visualize your data:
Google Data Studio provides you with a variety of visualization options to create visually appealing reports. Use charts, graphs, and tables to present your data in a way that is easy to understand and visually appealing.
● Use annotations to highlight important events:
Annotations allow you to add notes to your report and highlight important events, such as the launch of a new campaign or a significant increase in engagement.
● Use templates to save time:
Google Data Studio provides you with a variety of templates that you can use to create reports quickly. You can customize these templates to fit your specific needs, and they can save you time when building reports.
● Combine data from multiple Social media platforms:
If you are managing multiple social media platforms, you can use data blending to combine data from different sources. This will help you create a holistic view of your social media performance and identify trends across platforms.
● Use date ranges to track performance over time:
Google Data Studio allows you to track the performance of your social media campaigns over time. Use date ranges to compare performance week over week, month over month, or quarter over quarter. This will help you identify trends and track progress toward your goals.
Using Google Data Studio for social media analytics and reporting can help you track the performance of your social media campaigns and optimize your strategy. By connecting your social media platforms to Data Studio and building visually appealing reports, you can gain valuable insights into your social media performance and improve your results.